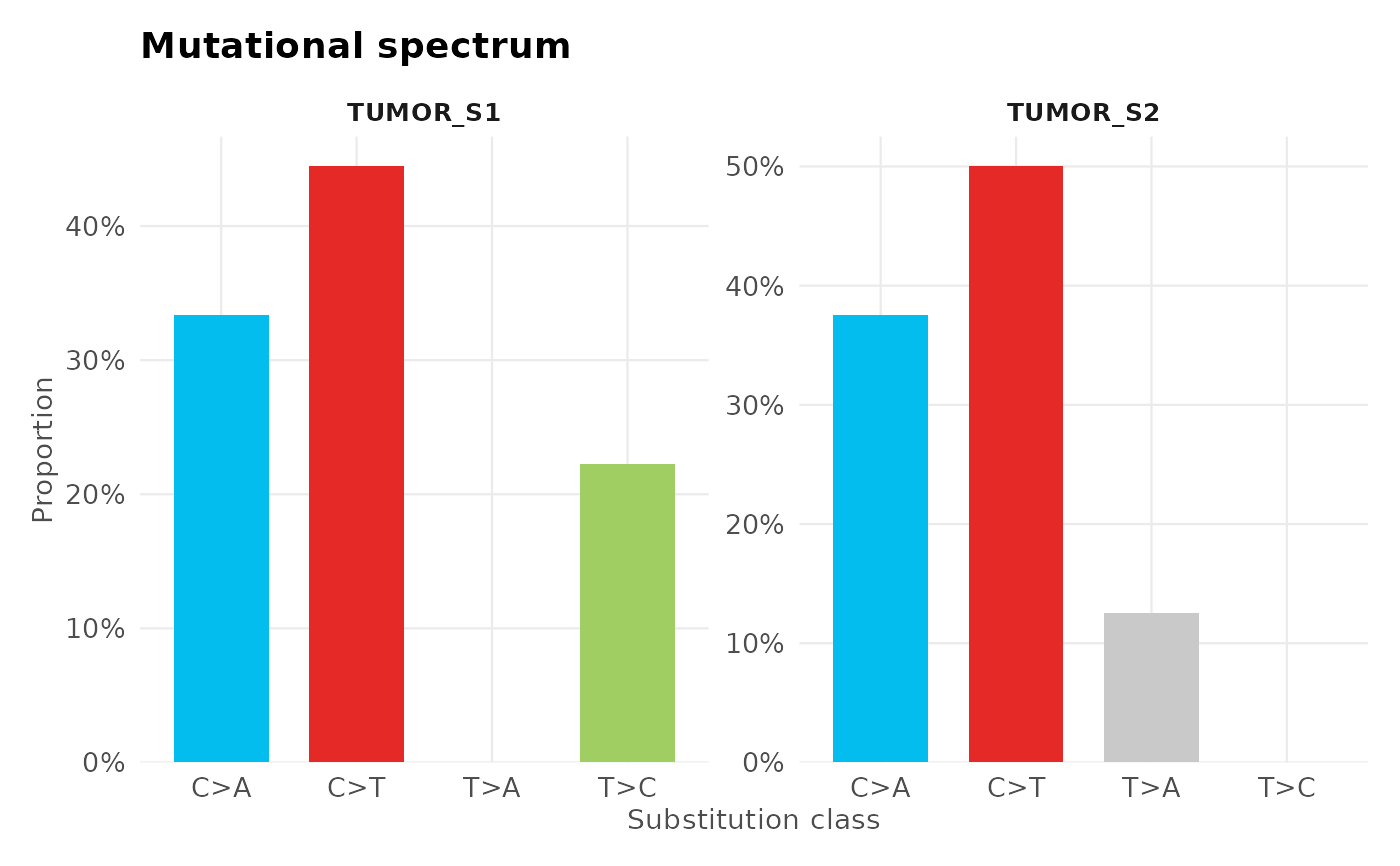
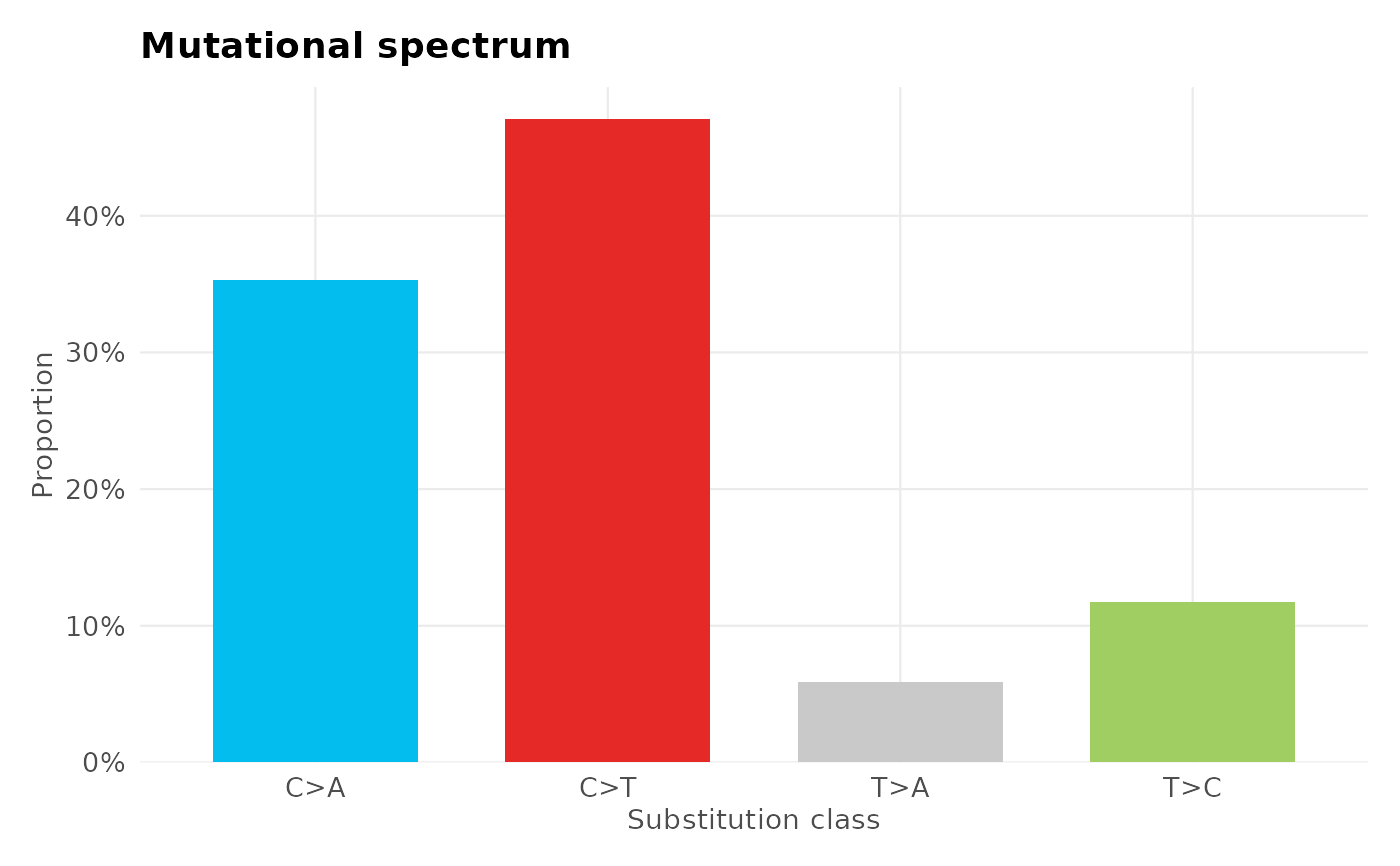
Plots the single-base substitution (SBS) spectrum — the relative frequency of each of the 6 substitution classes (C>A, C>G, C>T, T>A, T>C, T>G) — optionally broken down by trinucleotide context.
Usage
plot_variant_spectrum(
  variants,
  sample = NULL,
  context = FALSE,
  genome = NULL,
  facet_by_sample = FALSE,
  palette = NULL,
  normalize = TRUE,
  interactive = FALSE
)
Arguments
- variants
A
gvfobject or compatibledata.framecontaining SNVs. Indels are automatically excluded.- sample
Character. Sample name to filter on.
NULLuses all variants pooled (or facets by sample iffacet_by_sample = TRUE).- context
Logical. 96-trinucleotide context bars are not yet implemented; passing
TRUEaborts with an error. DefaultFALSE, which produces the 6-class SBS spectrum. See https://github.com/josh45-source/ggvariant/issues/1.- genome
Not yet implemented; passing a non-
NULLvalue aborts with an error. Reserved for futureBSgenome-based trinucleotide context extraction. See https://github.com/josh45-source/ggvariant/issues/1.- facet_by_sample
Logical. If
TRUE, facets the plot by sample. DefaultFALSE.- palette
Named character vector with names matching substitution classes (
"C>A","C>G", etc.).NULLuses COSMIC-style colours.- normalize
Logical. If
TRUE(default), shows relative proportions. IfFALSE, shows raw counts.- interactive
Logical. If
TRUE, returns aplotlyinteractive plot (requires theplotlypackage).
References
Alexandrov LB, Kim J, Haradhvala NJ, et al.; PCAWG Consortium (2020). The repertoire of mutational signatures in human cancer. Nature, 578(7793), 94-101. doi:10.1038/s41586-020-1943-3
Blokzijl F, Janssen R, van Boxtel R, Cuppen E (2018). MutationalPatterns: comprehensive genome-wide analysis of mutational processes. Genome Medicine, 10(1), 33. doi:10.1186/s13073-018-0539-0
See also
plot_lollipop(), plot_consequence_summary(), gv_palette()
Other ggvariant plots:
plot_consequence_summary(),
plot_lollipop(),
plot_oncoprint(),
plot_tmb()
Examples
vcf_file <- system.file("extdata", "example.vcf", package = "ggvariant")
variants <- read_vcf(vcf_file)
#> ℹ Reading VCF: example.vcf
#> ✔ Reading VCF: example.vcf [10ms]
#>
#> Loaded 19 variant records across 7 chromosomes.
# Basic 6-class SBS spectrum
plot_variant_spectrum(variants)
#> Excluded 2 non-SNV records from spectrum plot.
 # Faceted by sample
plot_variant_spectrum(variants, facet_by_sample = TRUE)
#> Excluded 2 non-SNV records from spectrum plot.
# Faceted by sample
plot_variant_spectrum(variants, facet_by_sample = TRUE)
#> Excluded 2 non-SNV records from spectrum plot.