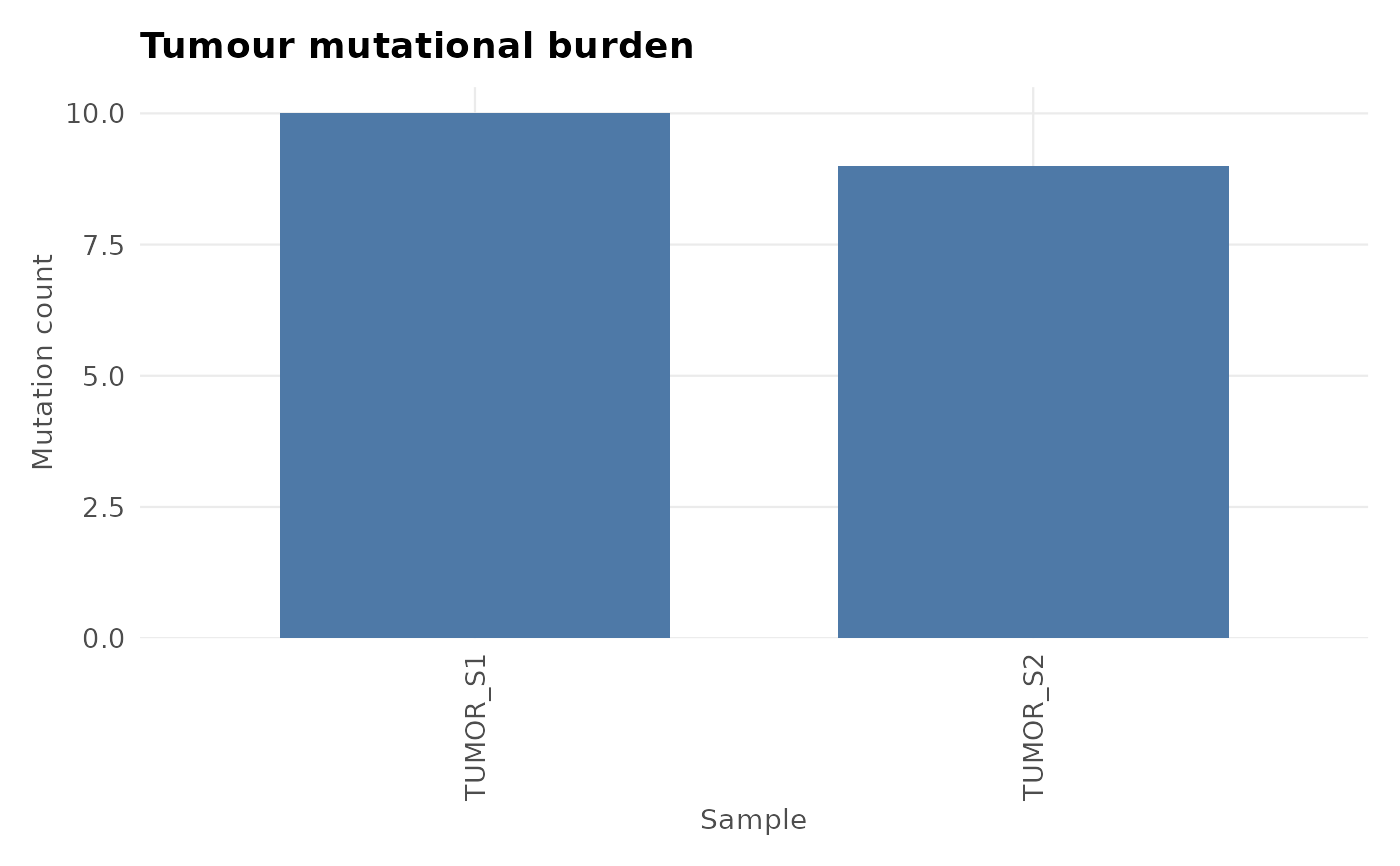
Plots per-sample tumour mutational burden (TMB): the number of mutations carried by each sample, optionally normalised to mutations per megabase.
Usage
plot_tmb(
  variants,
  samples = NULL,
  mb_size = NULL,
  sample_order = NULL,
  palette = NULL,
  interactive = FALSE
)
Arguments
- variants
A
gvfobject fromread_vcf()orcoerce_variants(), or anydata.framewithsampleandposcolumns.- samples
Character vector of sample names to include.
NULL(default) uses every sample present invariants.- mb_size
Numeric. Size, in megabases, of the sequenced region used to normalise mutation counts into mutations/Mb.
NULL(default) plots raw mutation counts instead.- sample_order
Character vector giving an explicit left-to-right sample order, e.g. to align with
plot_oncoprint()'s memo-sorted column order.NULL(default) orders samples by descending TMB.- palette
Single hex colour string for the bars.
NULLuses a built-in default.- interactive
Logical. Returns a
plotlyobject ifTRUE.
Details
The per-sample mutation count is computed by an internal helper shared
with any future plot_oncoprint() TMB marginal, so the two always agree.
Pass mb_size (the size, in megabases, of the sequenced region) to
convert raw counts into mutations/Mb, the conventional TMB unit; leave it
NULL to plot raw counts.
References
Chalmers ZR, Connelly CF, Fabrizio D, et al. (2017). Analysis of 100,000 human cancer genomes reveals the landscape of tumor mutational burden. Genome Medicine, 9(1), 34. doi:10.1186/s13073-017-0424-2
See also
plot_oncoprint(), gv_palette()
Other ggvariant plots:
plot_consequence_summary(),
plot_lollipop(),
plot_oncoprint(),
plot_variant_spectrum()
Examples
vcf_file <- system.file("extdata", "example.vcf", package = "ggvariant")
variants <- read_vcf(vcf_file)
#> ℹ Reading VCF: example.vcf
#> ✔ Reading VCF: example.vcf [11ms]
#>
#> Loaded 19 variant records across 7 chromosomes.
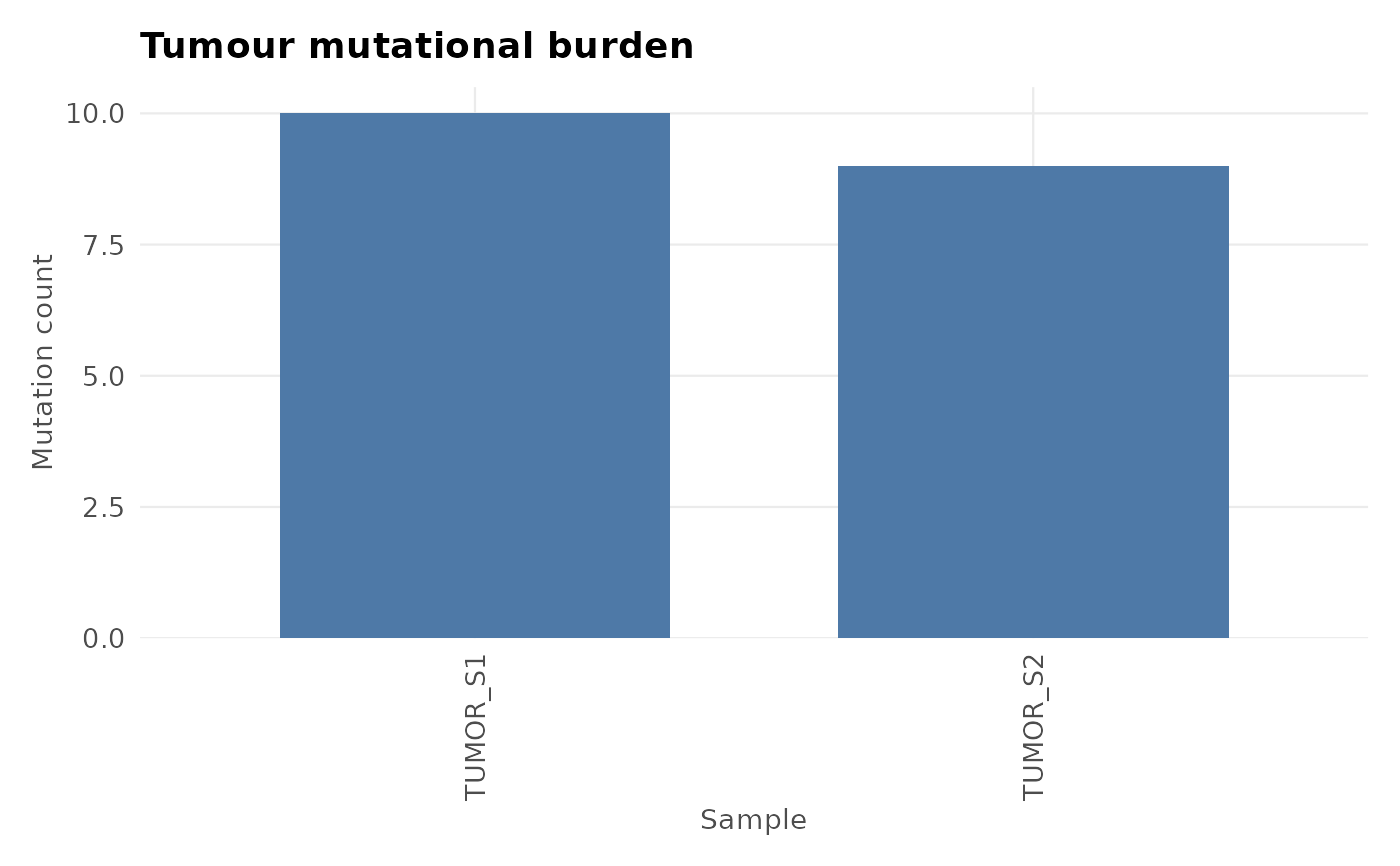
# Raw mutation counts, samples ordered by descending TMB
plot_tmb(variants)
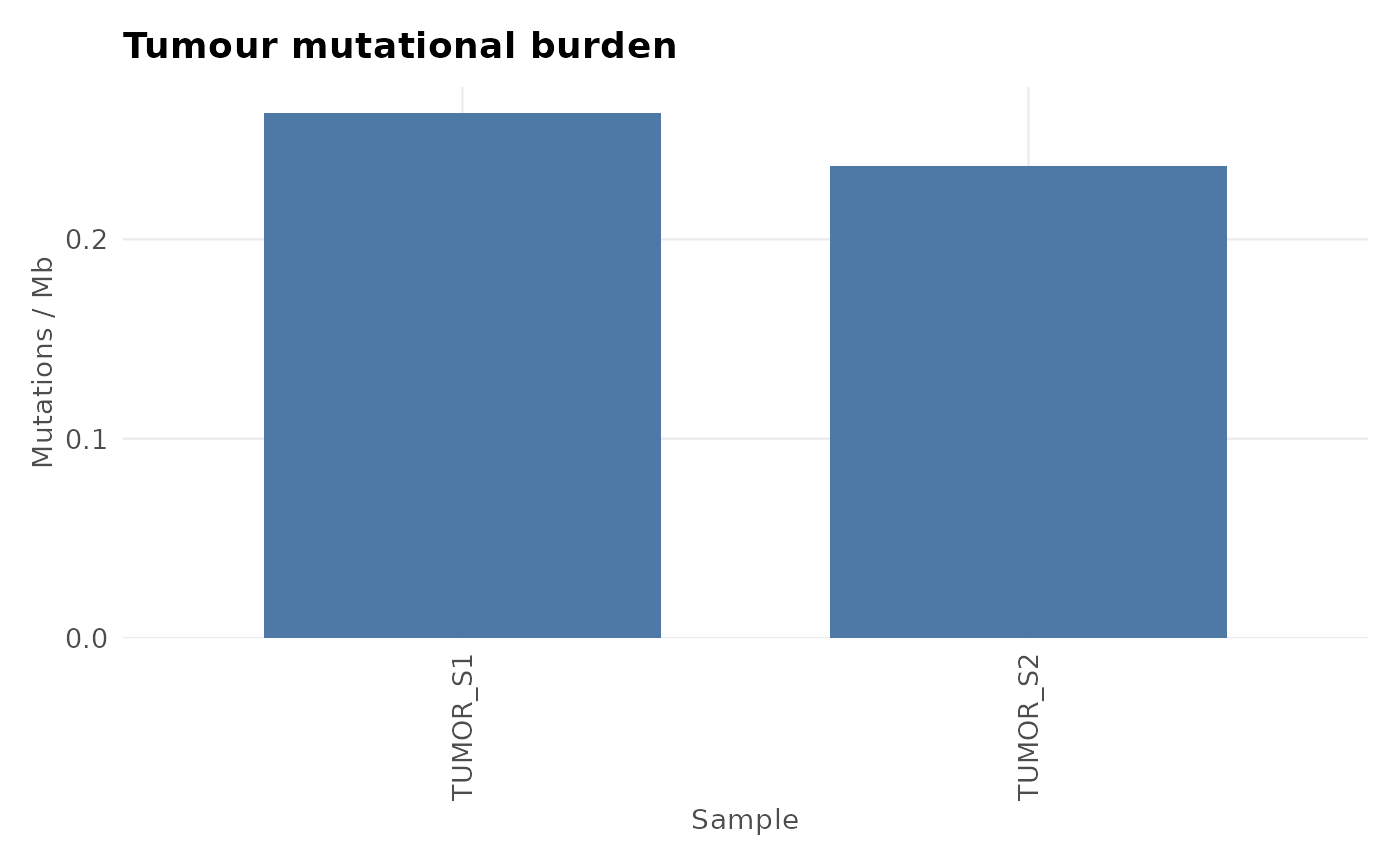
 # Normalised to mutations/Mb for a 38 Mb exome
plot_tmb(variants, mb_size = 38)
# Normalised to mutations/Mb for a 38 Mb exome
plot_tmb(variants, mb_size = 38)
 # Aligned to a specific sample order, e.g. from plot_oncoprint()
plot_tmb(variants, sample_order = c("TUMOR_S1", "TUMOR_S2"))
# Aligned to a specific sample order, e.g. from plot_oncoprint()
plot_tmb(variants, sample_order = c("TUMOR_S1", "TUMOR_S2"))